Deprecated: mb_strpos(): Passing null to parameter #1 ($haystack) of type string is deprecated in /home/sites/yellowcog.com/public_html/libraries/vendor/joomla/string/src/phputf8/mbstring/core.php on line 41
Deprecated: mb_strpos(): Passing null to parameter #1 ($haystack) of type string is deprecated in /home/sites/yellowcog.com/public_html/libraries/vendor/joomla/string/src/phputf8/mbstring/core.php on line 41

Yellowcog driver and vehicle data collection with eye-tracking, physiological monitoring and car performance data. Lots of channels of data are collected in this video which is recorded from the driver's point of view. The video shows the driver's "point of gaze" (using eye-tracking technology), heart rate, breathing rate, core body temperature and an exertion score. Added to the physiological information is a range of car data.
The on-screen overlays show the following information:
- Eye-tracking circle -- The white circle shows where the driver's "point of gaze" falls. Black concentric circles are used to represent peripheral vision.
- Exertion -- a measure of how hard the driver is working. E.g. 0% represents a person at rest and 100% would be flat-out in the gym.
- Body temperature -- A gauge showing the core temperature of the driver. This is measured by taking skin temperature and combining this with other parameters to approximate the core body temperature.
- Heart rate -- the beating heart icon pulses in time with the driver's heartbeat. The number in the middle is the beats per minute.
- Breathing rate -- The lungs icon expands and contracts according to the driver's chest expansion. The number in the middle is the average breaths per minute.
- Speed -- this is the speed of the car, taken from GPS and also accelerometer readings.
- RPM -- this is the number of revolutions per minute of the engine. The information comes direct from the car's on-board Engine Control Unit (ECU).
- Power -- the kilowatt output of the engine, taken from the ECU.
- Throttle -- the physical position of the throttle pedal.
- G Force -- this is the physical g-force experienced by the driver and is caused by cornering, accelerating and braking.
![]() Yellowcog developed the system for use in top-end motorsport which has so far included Le Mans, IndyCar and rallying. Recently we used a system for a word record attempt by Mark Higgins who set a new lap record for a production car (a 2015 Subaru WRX STi) on the Isle of Man TT circuit -- have a look around YouTube using yellowcog, Subaru and TT as search terms - you can see just how hard a racing driver needs to work to be the best!
Yellowcog developed the system for use in top-end motorsport which has so far included Le Mans, IndyCar and rallying. Recently we used a system for a word record attempt by Mark Higgins who set a new lap record for a production car (a 2015 Subaru WRX STi) on the Isle of Man TT circuit -- have a look around YouTube using yellowcog, Subaru and TT as search terms - you can see just how hard a racing driver needs to work to be the best!
For this video, the car and driver are both well within limits on public roads. Rather than the extremes this video is all about how a driver handles a car in typical conditions. It shows how visually alert a driver needs to be to stay safe. The circle hovering about on the screen is the point the driver is looking at. You can see the eyes flicking between mirrors, road signs and potential hazards. The whole video is like a live monitored version of the Hazard Perception Test (required as part of the UK's driving licence theory test). One thing to watch for is how rather than staring at each-and-every point of interest, the eyes cast across the scene to quickly capture the situation.
Heart rate and breathing are controlled and stable. The driver in this example has a resting heart rate of about 60bpm so being up at 84 represents the extra mental and physical effort that driving requires. We have one example on our files where a drive just like the one here was interrupted when a car pulled unexpectedly out of a side road causing the driver's heart to jump within a beat from 80bpm to 120bpm.
 Yellowcog’s Pilot™ driver monitoring system is being used to collect driver vital signs which are analysed to gain insight into the physiology of racing in one of the fastest formulas in the world. The project is ongoing and has already led to innovations in our hardware, software and algorithm development.
Vital signs are transmitted via the car’s existing on-board telemetry system straight to the pit wall. The data includes heart rate, breathing rate, g-forces, temperature and more. All the data is then available alongside the car telemetry data so that the car and driver can be analysed as a single entity.
We have had a lot of interest in driver monitoring over the last few months and will be rolling out to more teams very soon. If you are interested in the Yellowcog’s Pilot™ system then contact us via the www.yellowcog.com website.


Rallye-info.com published an article last week (http://www.rallye-info.com/article.asp?stid=11343) about yellowcog’s motorsport driver safety technology, named Pilot™, in the recent rally in Kenya. The article explains how the course medics were able to monitor drivers’ vital signs remotely.
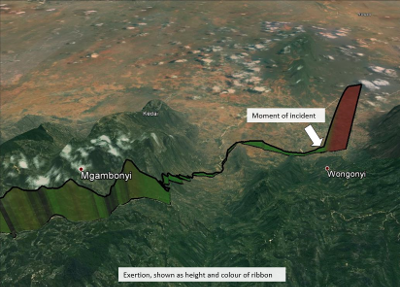
 The importance of having such physiological information was shown when Geoff Bell and Tim Challen rolled their Datsun 260Z in spectacular fashion! They both escaped serious injury but the changes in the physiological data in the moments after the accident were dramatic, as can be seen from this Google Earth map. The map shows a combined ‘exertion index’ where the height and colour of the ribbon shows how extreme the vital signs were. This sort of information can be used to tailor the response of the medics, for example by prioritising the person most in need.
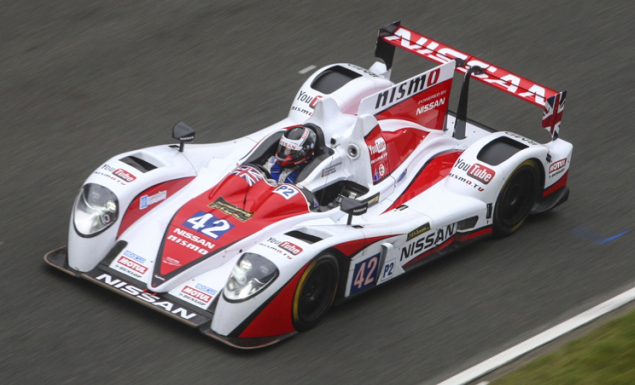
 Pilot™ is yellowcog's new driver vital signs (biometric) system for motorsport. First proven in the most demanding circuit racing event on the calendar: the 24 Hours of Le Mans at Circuit De La Sarthe. Greaves Motorsport's Car #42 was fitted with a Pilot™ device. Each of the three drivers wore a wireless cheststrap under his overalls and were monitored while in the car over the full duration of the 2013 race. Driver change-overs were automatically handled by the system with driver biometrics relayed live via the car’s telemetry to track-side displays as part of the Nismo Juke Ride set-up.
The Pilot™ combines a Bluetooth radio with processing and data conversion hardware. Yellowcog’s own software libraries and data analysis routines package the information and deliver this to the car via RS-232, CAN or analogue.
 Using small wireless sensors, a house was monitored in every way we could imagine. We combined many of our OEM ANT wireless sensors and also security and electricity monitoring systems. We recorded: doors and window positions; temperature and humidity; light usage and light levels; energy usage; movement and vibration; and many derived parameters. We then coupled this with our CogWrangler software and added a 3D visualisation of the building. Using various techniques we can automatically report how secure and "lived in" the building is. For example, moving around the house and making a cup of tea are all fused to show how much activity there is and how that compares to learned patterns. The system can therefore be used to report on whether the occupant (say, someone with health issues) is behaving normally.
